
Partners: National Bank of Rwanda (NBR) and Cenfri, through the Rwanda Economy Digitalisation Programme
Data sources: Supply-side data from institutions regulated by NBR
Capabilities: Data engineering, data analysis and dashboard development
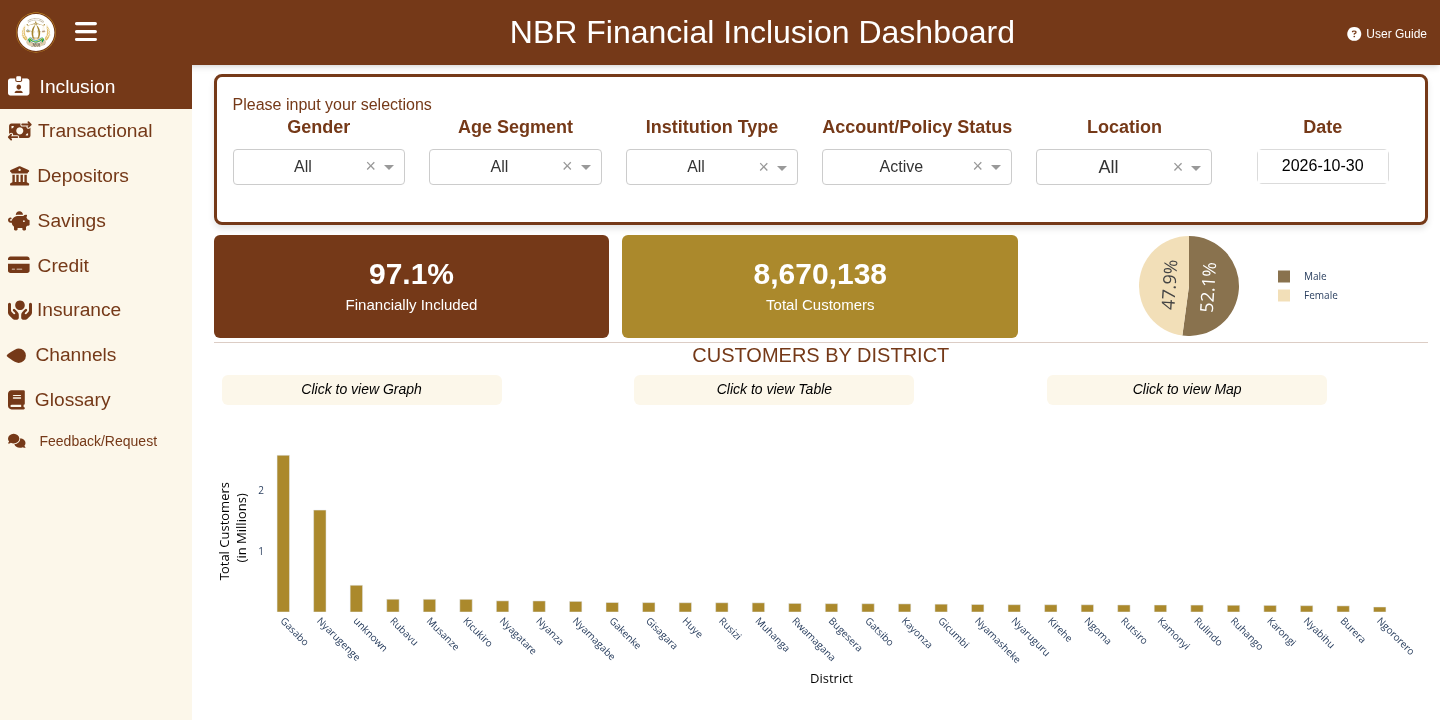
Overview
Household surveys provide valuable snapshots of financial inclusion. Regulatory data adds a more frequent view of how people engage with financial services. Working with Cenfri and NBR, we help make this data useful for monitoring inclusion and identifying gaps.
The work brings together data analysis, engineering and visualisation within the Rwanda Economy Digitalisation Programme. The public Financial Inclusion Dashboard is published by NBR.
From reporting data to usable indicators
The dashboard draws on information from banks, microfinance institutions, SACCOs, insurers and e-money issuers. Its sections cover inclusion, transactions, depositors, savings, credit, insurance and service channels.
Users can explore the indicators by gender, age, location, institution type and account or policy status. This makes it possible to look beyond a national total and examine which groups and places remain underserved.
Supporting decisions
The dashboard gives policymakers, financial service providers and researchers a shared starting point for asking more specific questions about access and use. Supply-side indicators complement survey evidence: an account, an active account and regular use are different measures, and need to be interpreted in context.