
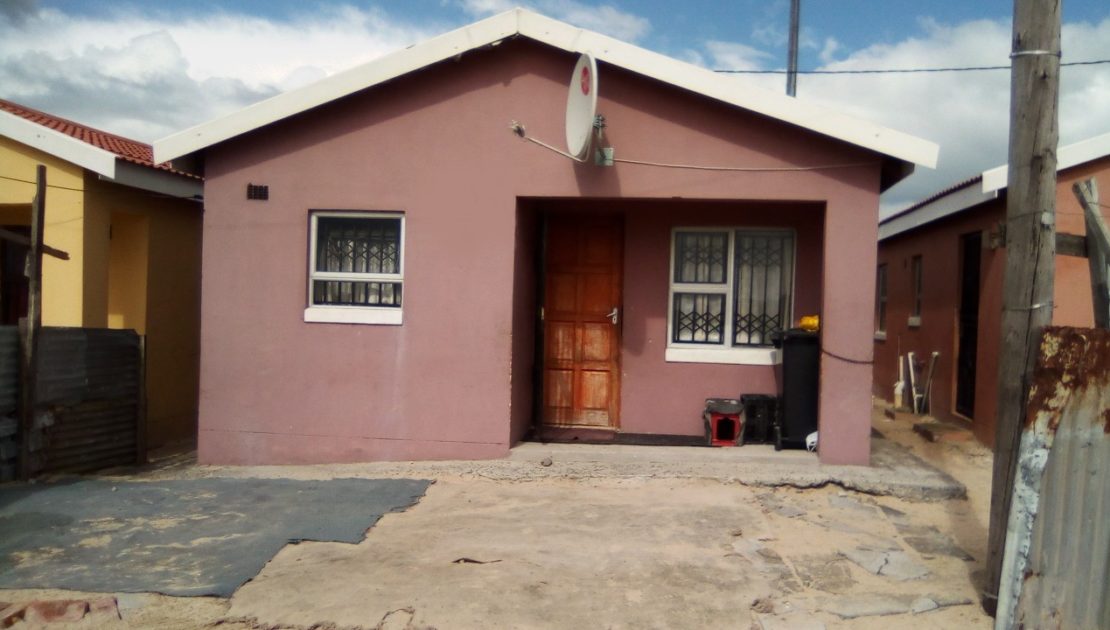
South Africa’s title deed backlog is a persistent challenge. Millions of state-subsidised properties have been built and occupied, yet in around one million of these properties, owners still do not have title deeds that would grant them full, legally recognised ownership.
71point4 has been engaged by the DBSA to provide technical support to the Titling Backlog Restoration Project on behalf of the National Treasury’s Cities Support Programme. Before the title deed backlog can be tackled, it needs to be defined and measured in a structured, replicable way. An initial deliverable on the project is therefore a dashboard that visualises and monitors a best estimate of the title deed backlog, alongside annual transfer volumes reflected in the Deeds Office records. The data can be explored at a provincial, local municipality, and Township (General Plan) level.
Methodology: Identifying the backlog
To arrive at backlog estimates, the team has worked with various data sources including data on approved general plans, Google Footprints data, data from the Registrar of Deeds as well as provincial gazettes. The methodology is outlined in the schema below:
Each property is assessed using data from various sources.
The methodology steers clear of data that might be lie in data silos accessible only to provincial or municipal officials. Aside from being difficult to access, these data sources are difficult to validate and maintain over time.
But the methodology does not obviate the need for provincial and municipal engagement and validation. On the contrary, it is critical to refine dashboard estimates with ongoing input. In the first instance, we only have visibility once a General Plan has been approved. There are backlog townships where even this step has not been completed. These townships need to be specifically flagged and incorporated into the estimates.
In addition, we don’t have accurate data on whether properties are occupied. Only those units that have been allocated and handed over to beneficiaries will require a title deed. Our methodology uses Google Footprint data as an imperfect proxy; while unusual, it is possible for stand to contain a structure (and to display a footprint) even if that stand has never been occupied or owned.
The methodology allows us to quantify the backlog into a number of segments, outlined below:
These segments align with available data as well as key stages in the titling process.
While we don’t currently have data where there is no approved General Plan (Segment 1), other segments have been quantified and displayed on the backlog dashboard. A drill-down spatial layer featuring local municipality and provincial borders makes it easy to navigate to the area of interest.
For the purposes of displaying data on the backlog, we have limited our analysis to townships where there are at least 50 demarcated erven. We note that this may exclude some backlog townships, such as those where subdivisions are pending. Using this limit, we arrive at a national backlog of 857 711 units, with two thirds of these units (573 117) in the Transfers Pending segment.
On the face of it, in the Transfers Pending Segment beneficiary verification could proceed immediately as no outstanding township establishment barriers to transfer remain.
Methodology: Identifying beneficiary transfers
The dashboard also displays data on beneficiary transfers at the same three levels of geography, using the same drill-down map to track where transfers occur. A time series of total transfers is also included, further broken down by gender and age at the time of the transfer.
We identify beneficiary transfers as those where the buyer is an individual and the seller is a government entity, state-owned enterprise, or selected company known to develop subsidy housing. We also require that the sales price is below the prevailing subsidy quantum set by the department of human settlements.
Note that we do not explicitly require that the transferred property was, in fact, part of the backlog. Presumably many transfers are of newly constructed and occupied units or stands that are not in the backlog. While it may be theoretically feasible to restrict transfers to backlog townships, from a technical perspective this would require a defined period after occupation for registration to occur, beyond which a property would be considered part of the transfer backlog. It would also require reliable data on occupation dates for all subsidised housing units. Neither currently exist.
That said, the data indicates that there were 20 869 transfers in 2026. This is roughly 4% of the backlog in the Transfers Pending segment and just 2% of the total backlog.
Visit the dashboard and give us feedback
Our estimates are a starting point, not a definitive measure of the backlog, and we recognise that there are gaps and limitations in the available data. We therefore urge you to explore the dashboard and share your feedback. We would particularly welcome comments on the methodology, the assumptions underpinning our estimates and any local knowledge or data that could help us validate or improve the estimates for specific municipalities and townships.
We aim to make the methodology and estimates as transparent and replicable as possible, while continuing to refine them through engagement with those working on the ground. Your feedback is invaluable in helping us build a more accurate picture of the backlog.